BNB (BNBUSD) is down 1.41% at Sep 10 00:00(ET), now at $721.6, with a 7-day down of 0.08%.
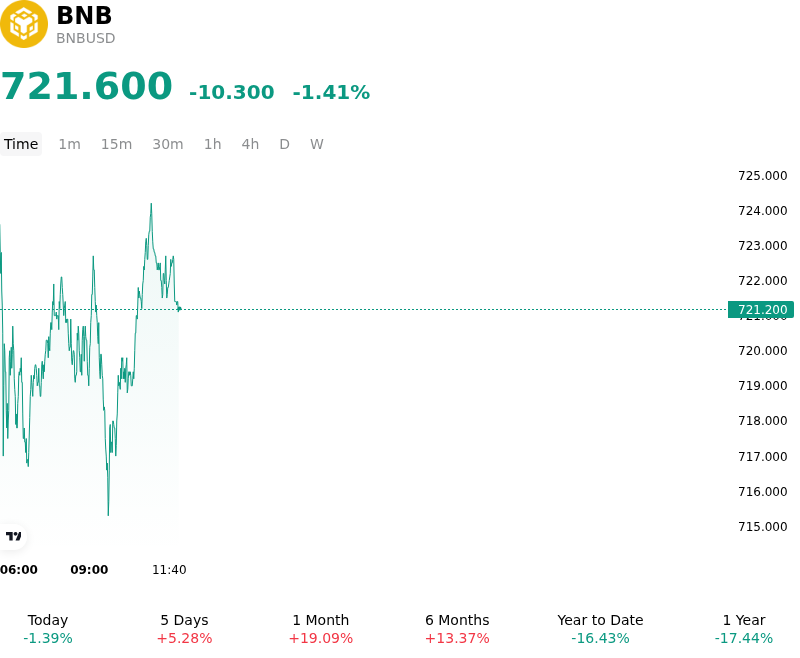
What is driving BNB (BNBUSD)’s stock price down today?
The downward movement in BNB reflects a broader risk-off shift across digital asset markets, driven primarily by tightening macro liquidity and rising global yield pressures. Geopolitical tensions pushing energy prices higher have renewed concerns over persistent inflationary pressure ahead of key economic releases and the upcoming Federal Reserve policy meeting. As elevated U.S. Treasury yields and a firmer U.S. dollar weigh on overall risk appetite, capital has temporarily retreated from major altcoins. In this environment, market participants reduced their exposure to high-beta smart contract platform tokens, prioritizing liquidity preservation over speculative positioning.
The decline was further amplified by localized long liquidations within the crypto derivatives market. Elevated leverage accumulated during recent ecosystem rallies made derivatives positioning vulnerable to unexpected macro headwinds. As major benchmark digital assets tested lower support levels, cross-margin liquidations swept through altcoin positions, triggering systematic sell orders for BNB across spot and perpetual futures markets. The liquidity contraction across decentralized venues and centralized order books accelerated the pullback, as buying depth proved insufficient to absorb the sudden wave of position unwinding.
Despite the intraday pressure, the structural narrative surrounding BNB Chain remains supported by robust on-chain metric trends and ecosystem expansion. BNB Chain continues to maintain a commanding share in real-world asset tokenization, particularly tokenized stocks, while expanding its decentralized exchange volume and launchpad infrastructure. However, in the immediate term, macro-driven risk aversion and broader crypto market volatility outweigh fundamental network growth. Investors remain focused on upcoming monetary policy signals, global yield trajectories, and broader market leverage conditions to assess when liquidity will stabilize and risk appetite will return to the ecosystem.
Technical Analysis of BNB (BNBUSD)
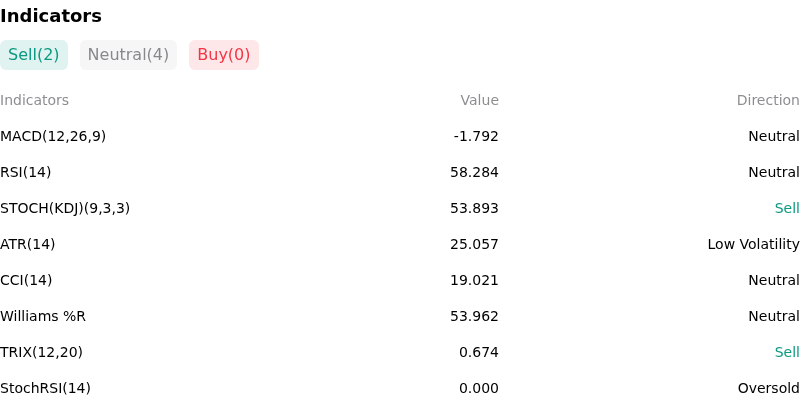
Technically, BNB (BNBUSD) shows a MACD (12,26,9) value of -1.792, indicating a neutral signal. The RSI at 58.284 suggests neutral condition and the Williams %R at 53.962 suggests neutral condition. Please monitor closely.
More details about BNB (BNBUSD)
Recent Events and Risks:
- Macro Risk Aversion & Inflation Data Uncertainty: Broad crypto market de-risking ahead of key U.S. inflation reports (CPI and PPI) has exerted downward pressure on major altcoins, leaving BNB vulnerable to macro-driven pullbacks if interest rate expectations shift hawkishly.
- Technical Overbought Conditions & Volume Cooling: Following a swift rally toward the $770–$780 resistance range, BNB's Relative Strength Index (RSI) breached overbought territory alongside a sharp drop in 24-hour spot trading volume, increasing the risk of a technical pullback toward the $727–$734 support floor.
- Derivatives Leverage Build-Up & Long Liquidation Exposure: High concentration of leveraged long positions following recent momentum leaves the market exposed to sudden liquidation flushes if price falls below short-term technical pivot points.
- Regulatory Deadlines & Operational Adjustments: Approaching Markets in Crypto-Assets (MiCA) compliance deadlines in Europe and upcoming exchange-level adjustments—such as Binance halting deposit and withdrawal support across select token networks on September 14—continue to generate background regulatory and liquidity friction for the ecosystem.
Find out more